ColdFusion, Image Processing, and Memory Spikes
I've been having some serious memory issues with a ColdFusion application that I've narrowed down to CF's image processing functions. Processing no more than 14 megs of images causes a spike of nearly a full gig of RAM while the images are being processed. Here's an example of what's happening when I process images through CF's built in CFImage functionality.
Setup
I have 7 images, which average 2 megabytes a piece. I'm uploading them via a flash widget which processes each in turn in the background. As each image is uploaded, the following things take place:
- Image is uploaded to server
- The file is saved to a temporary location on disk
- Check to make sure it's a valid file with IsImageFile
- If it's not, readbinary and rewrite it
- Get the image info via cfimage
- If the image is wider than 400 pixels, size it down to 400 wide
- Insert a record in the database for this image
And that's it... nothing more. This is what the memory usage on my server looks like after uploading 7 images, and then shortly after uploading a single image using the same steps through a standard upload form (to get the flash processing out of the memory usage picture).
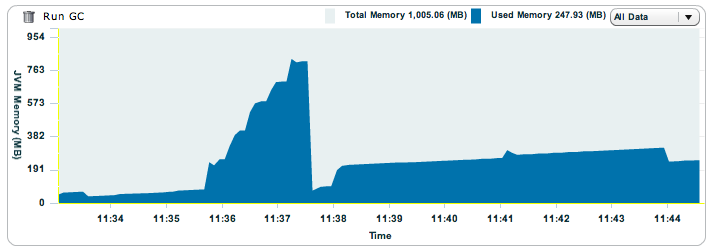
When I started the upload process of these 14 megs of images, the memory usage of the server (and I'm the only one using it) was idling at 80 megabytes. The plateaus on that spike (as one image finished processing, and the next started) are at:
- 253 mb
- 419 mb
- 586 mb
- 699 mb
- 817 mb
The smaller spike directly after was the single image I processed, which jumped from 260 mb to 304 mb.
Also, the server has never fully calmed down after processing the images. I'm really looking for some help to figure out what might be causing these issues. They're resulting in multiple JVM memory alerts daily, and other issues with the application such as dropped sessions and killed threads. If you've seen similar, or have a suggestion to alleviate the problem I'd love to hear it.
7 Comments
Daniel Sellers wrote on 03/06/09 3:02 PM
I have seen similar problems with cfimage... Its a CPU hog as well and I am hoping that at some point (soon please) Adobe will address this. Our server admins get unhappy when we spike the processor out at 100% while spiking memory as hundreds of users upload images... not a pretty picture. I haven't found a solution yet for either problem...Eric Cobb wrote on 03/06/09 3:29 PM
I ran into this once before with some image processing I was doing with the CF 8 image functions. After reading this blog post by Ray (http://www.coldfusionjedi.com/index.cfm/2008/11/1/ColdFusion-8-Image-Resize-options), I changed the interpolation to "highestPerformance" and the issues went away (or at least stopped causing problems).Daniel Short wrote on 03/06/09 3:41 PM
I'm definitely going to give that a try.Aaron Longnion wrote on 03/09/09 3:10 AM
Hey Dan, +1 on putting the image processing on another server, or at least on another CF instance. Another longer-term strategy is upgrading your servers to 64-bit, which removes the 1.4 G (or so) limit in the JVM for memory on each CF instance. The processing power is much improved, and you're realisically only limited in memory by how much you want to purchase for your servers. Mike Brunt highly recommend going 64-bit in his presenation at Adobe MAX Europe 2008.Steven Erat wrote on 03/18/09 9:29 AM
Although you may be on the right track when suspecting its the image processing that's leading to unusually high memory usage, there are still too many variables in the scenario to confirm that. I would first break the reproducible case into parts by eliminating the file upload part and using code that only performs the image manipulation operations. Also, for a good test case, get rid of other code like checking if its a real image file (since you know it is during your test). If possible, also repeat the experiment on a server that is not receiving any other requests. Before starting each attempt to reproduce the problem, restart the CF server. So if you run the experiment 3 times, restart the server 3 times, once before each test. Also, to make sure the the Server Monitor itself is not introducing an artifact, run the experiment several time after commenting out all the code while the server monitor runs for the same period of time (this is control experiment). The graph above seems to have a gentle upward memory creep (about a 15 degree slope) starting before the spikes in the middle, so it may be that this slope occurs even when you are not testing the image processing. If you see the slope when making (empty) requests over the same period of time, then there may be other things happening on the server causing it or it could be an artifact introduced by running the server monitor (think Heisenberg). Finally, if you're stripped down, ultra-controlled test case is NOT reproducing the problem, then starting adding back part of the original problem one step at a time. Like add back the isImage function, and test a couple times. If still not repro'ng the problem, then add back the image upload part. The idea here is to create the most discrete test possible by reducing the number of factors in the test setup.Daniel Short wrote on 03/18/09 9:41 AM
Absolutely good advice. For the moment who've moved the image processing to a separate instance until we can try to narrow everything down further. Thanks for the advice.
David Buhler wrote on 03/06/09 2:52 PM
I had the same problem. ImageMagic was also very CPU intensive. I lowered the quality some, but the best solution I can think of is to run the image processing on a separate server.